App & Wearable for Safe Running in the Dark
App and wearable that allows individuals to maximize their daily schedules by feeling safe during runs in the dark.
Project Summary
A significant hindrance that many people experience when they are trying to start running is time. Often there are so many activities that keep people busy during the light hours of the day, so many avid runners will risk their safety in regards to crime and traffic by fitting in a run during the morning or evening. Our team set out to minimize this risk so that all runners can share in the joy of exercising on their own time. When conducting a competitor analysis, our team realized that many existing running safety apps rely on speculation and bias to determine the reliability of an area.
With a goal of objective safety reporting in mind, we conducted extensive user research and determined that a wearable bracelet and companion app should alleviate concerns about running in the dark. The bracelet and the app alert the runner to the changing density of objective safety factors along their route and allow a remote companion to monitor their run for a quick emergency response.
Duration
August 2022 - December 2022
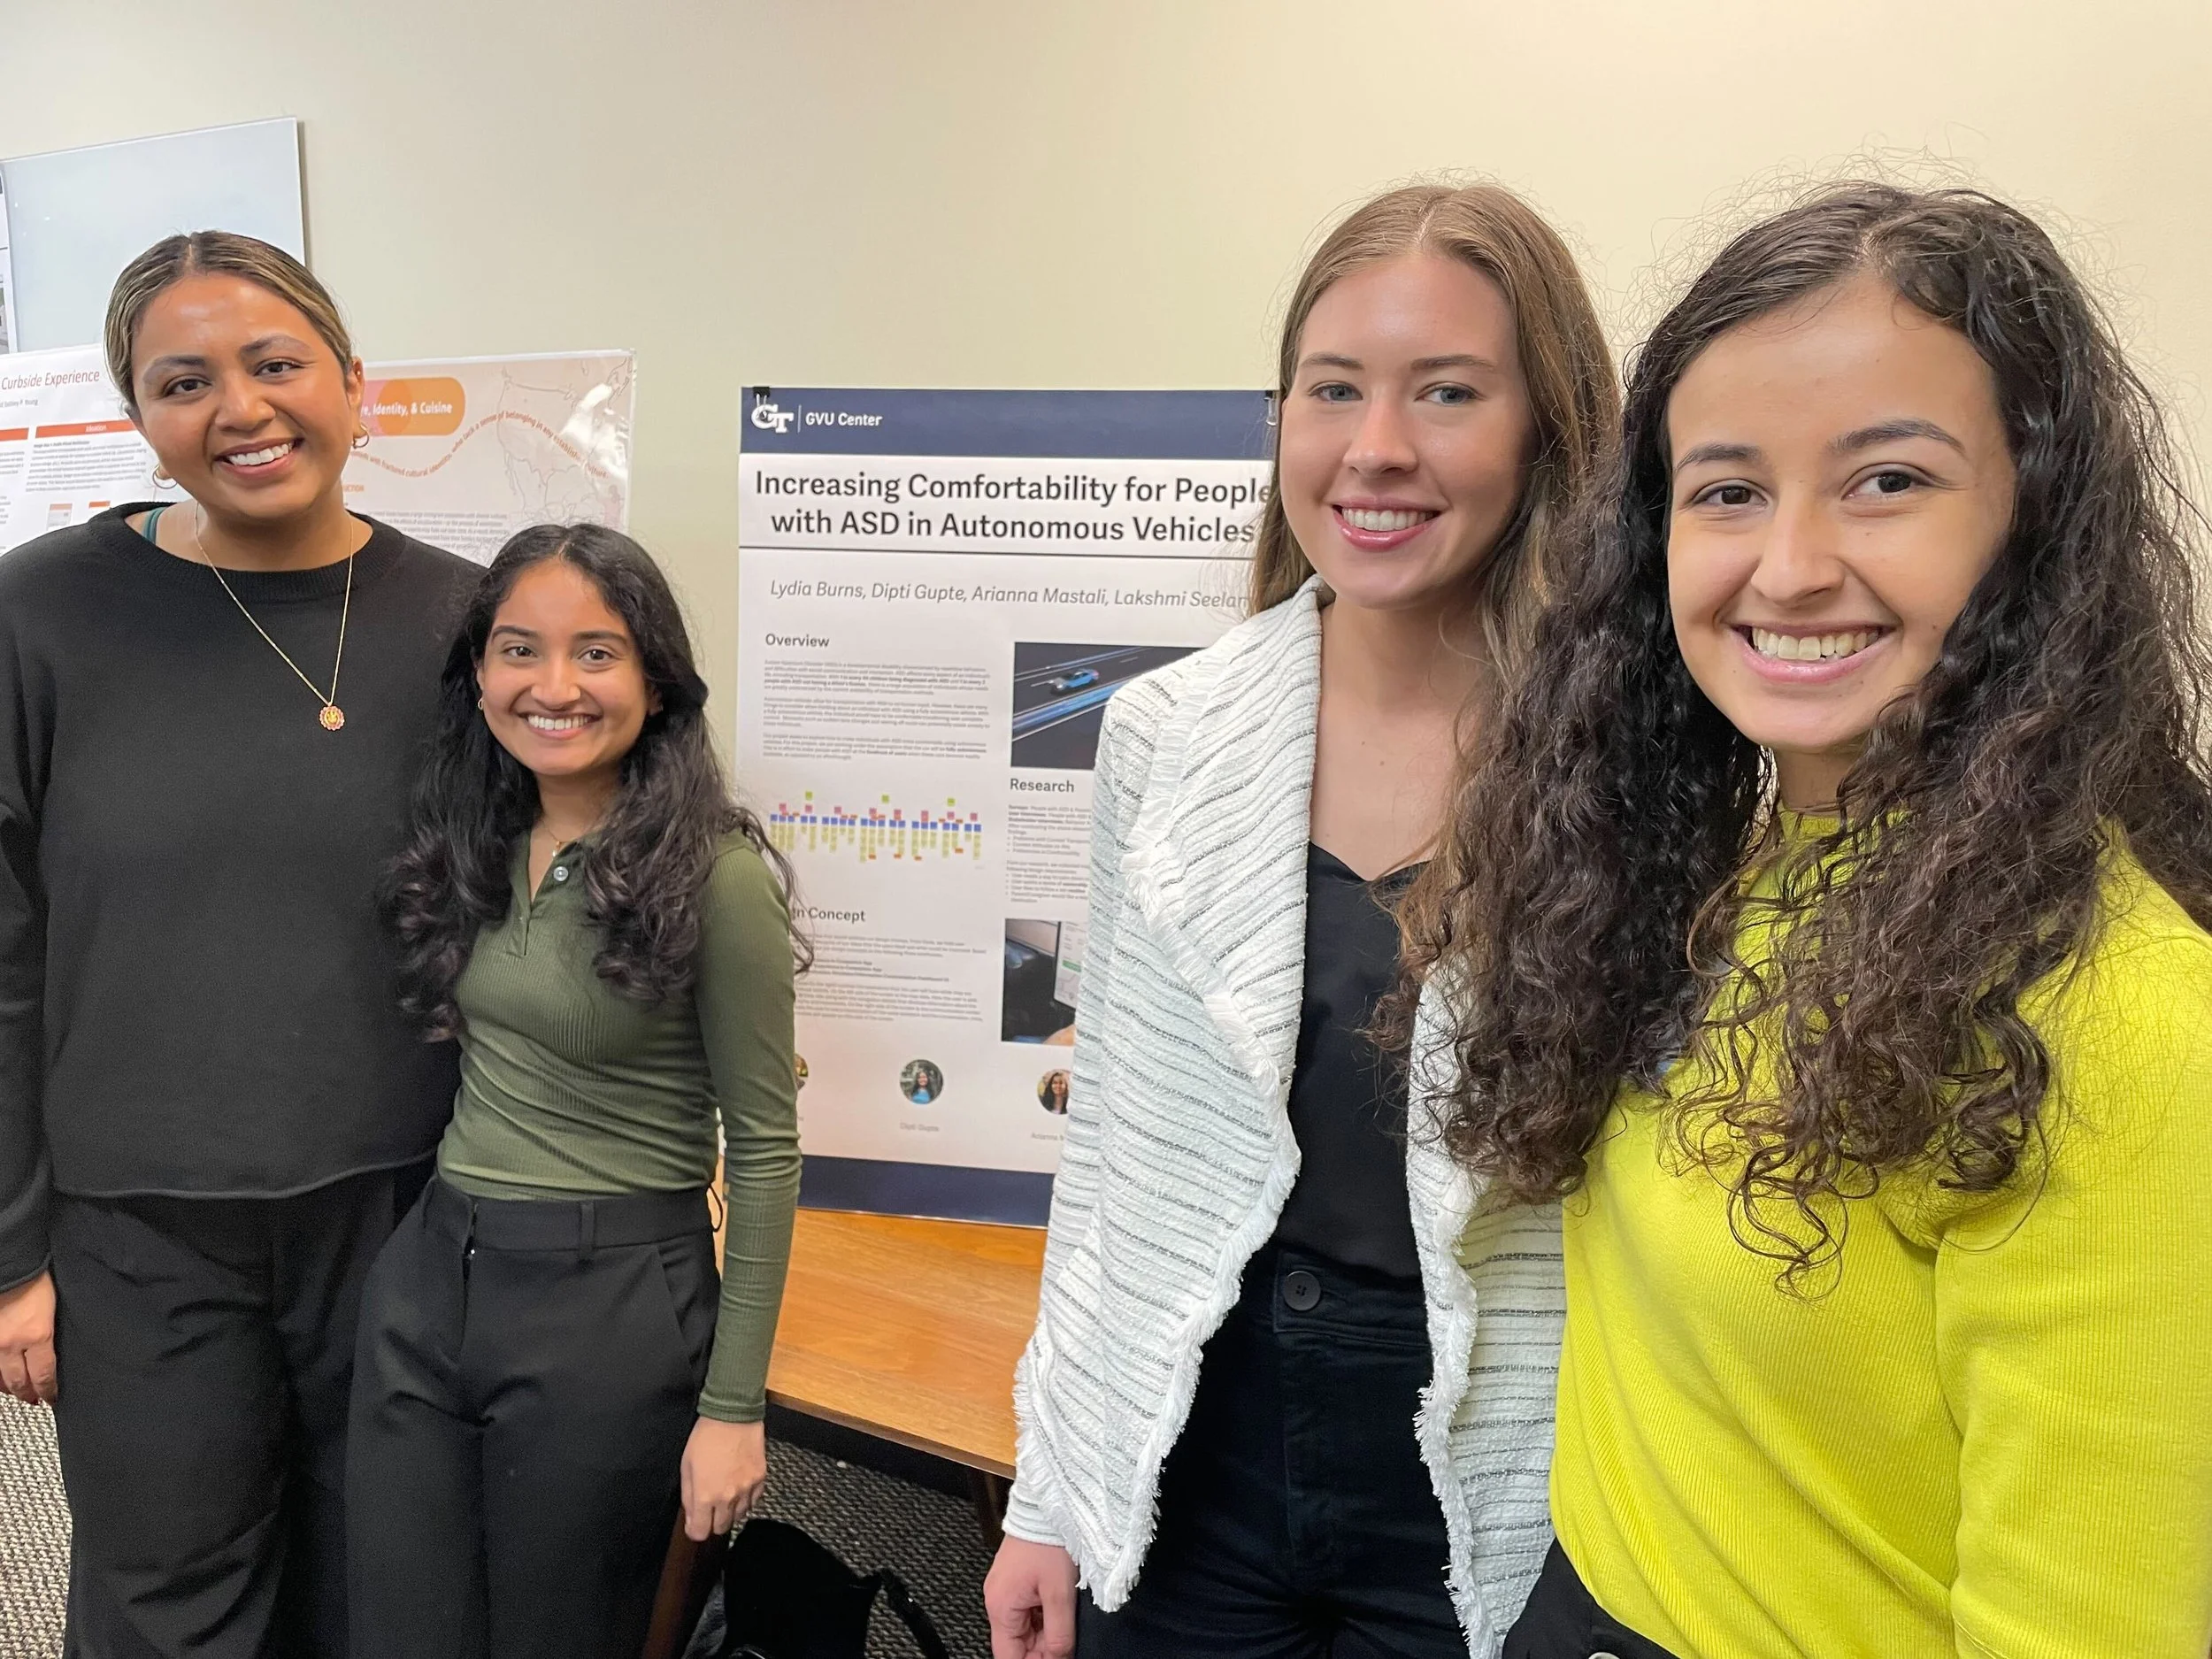
Team
Arianna Mastali, Dipti Gupte, Lakshmi Seelam
My Role
UX/UI Designer
Tools
Figma, Miro, Qualtrics, Balsamiq
Project Overview
Problem
Solo runners often need to fit in their workout during dark hours of the morning or evening, but risk their personal safety to achieve fitness goals.
User Group
Beginner to Advanced Solo Runners
Stakeholders
Law Enforcement
Family Members
Opportunity
Create a digital tool that provides runners with appropriate safety measures and a sense of peace that allows them to safely enjoy their run.
Research
Survey
These surveys allowed us to use likert scale and open ended questions to collect qualitative and quantitative data regarding the frequency of runs, types of digital interactions during workouts, and hesitations or observations about running in the dark.
One survey for runners (Distributed to running clubs, known runners, etc.)
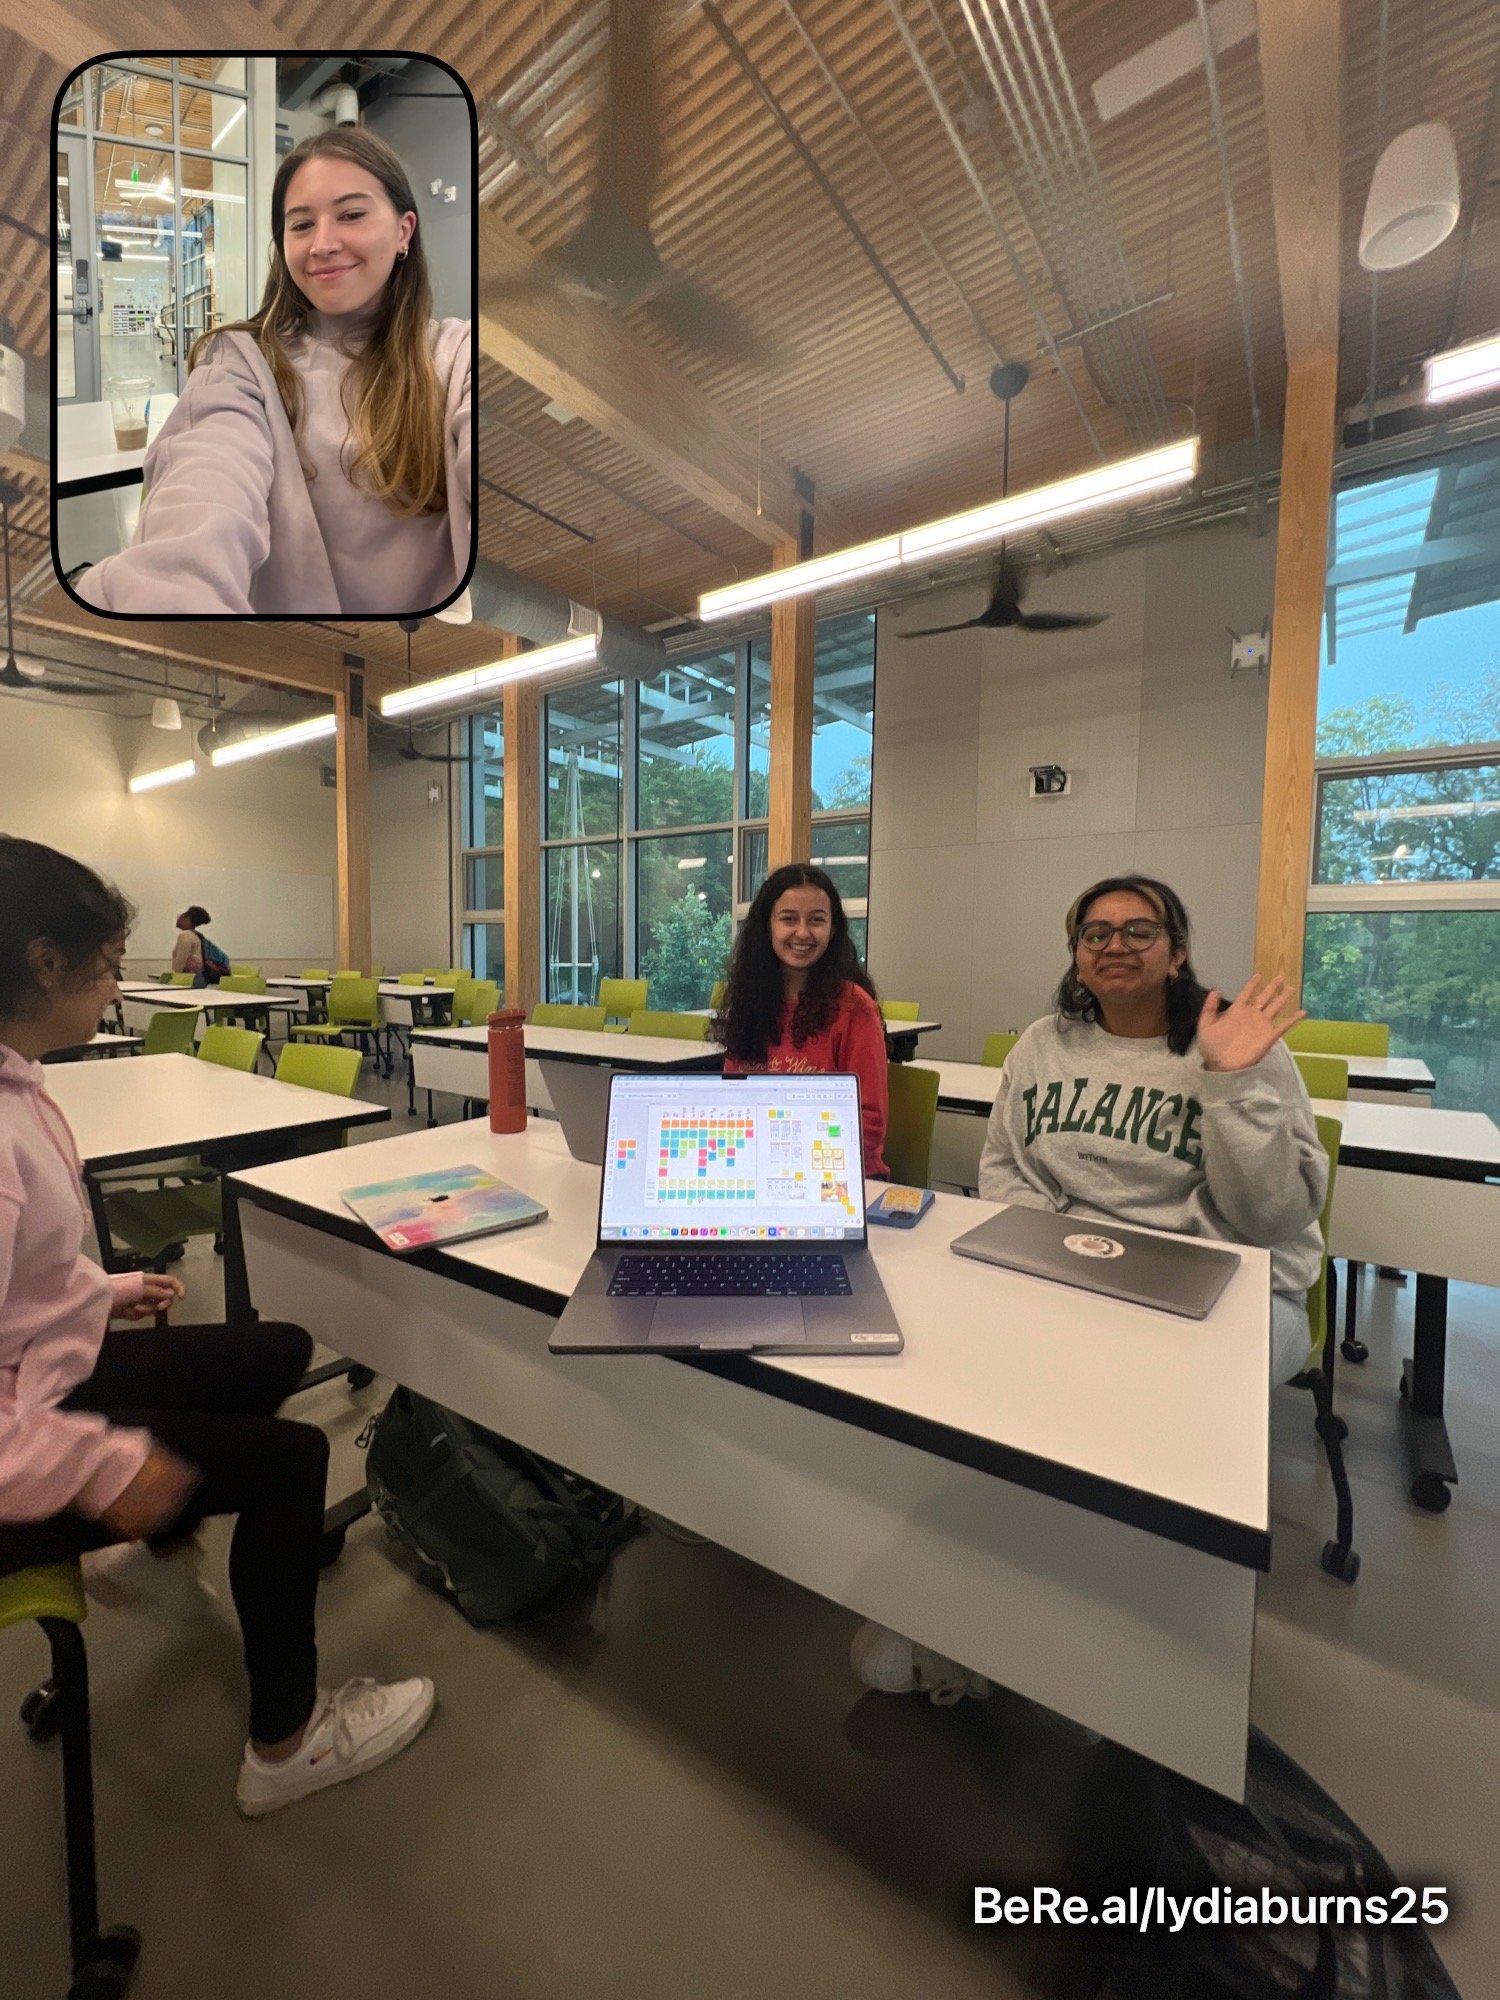
Semi-Structured Interviews
These interviews provided us with in depth perspectives regarding the practice of running and specifically running in the dark. Participants were able to share stories about their experiences to reveal opportunities for technological intervention.
Two interviews with runners
Research Objectives
Understand what makes runners feel safe or unsafe during a run
Learn about the user’s motivations for running in the dark
Determine runner’s needs and preferences for their workouts
Cultural Probe
The cultural probe allowed us to understand our users’ true motivations and values in regards to running in the dark through a creative approach. Unlike a survey or an interview, participants were prompted with activities such as drawing that yielded insightful responses participants may not have offered in a conversation.
Data Analysis
Survey Analysis
To review the findings from our survey, we generated graphs to visualize the data.

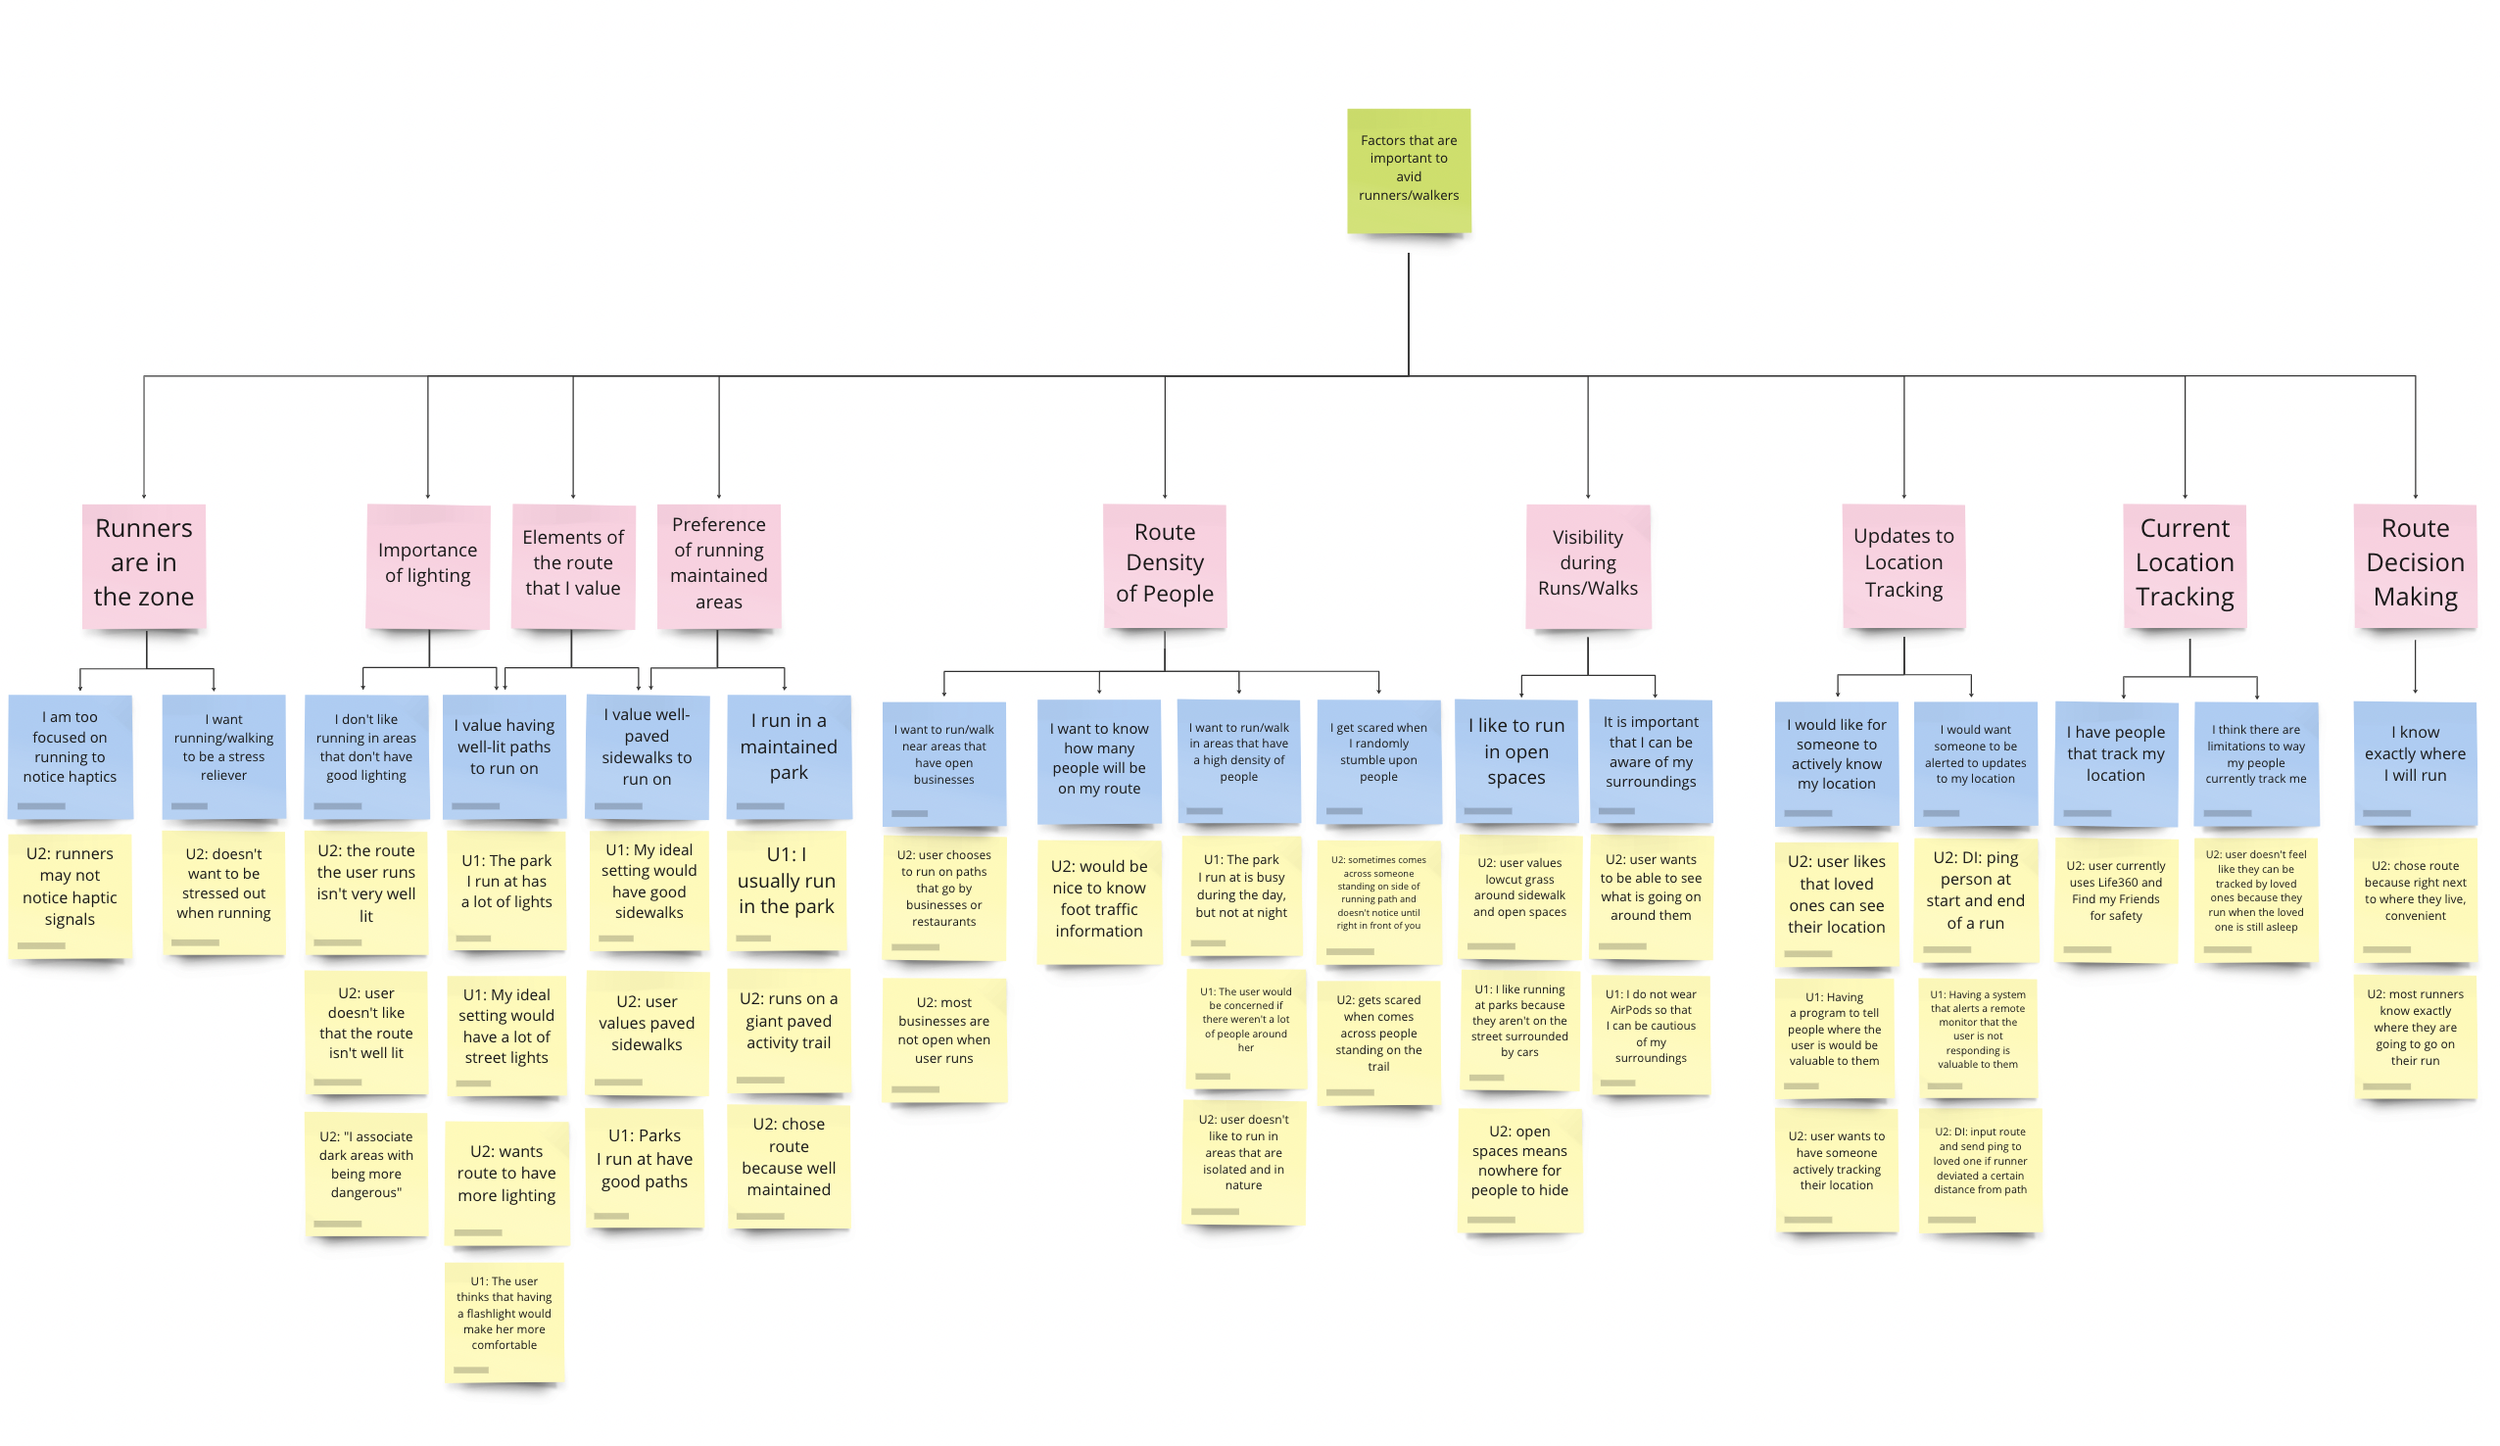
Interview Analysis
In order to evaluate and sort our findings from the interviews, we conducted an interpretation session and compiled the notes into an affinity map.

Cultural Probe Analysis
From the drawings in our cultural probe, we coded the aspects of the drawing into safety factor categories.
Findings
Finding One
Users value lighting as the most important safety factor in terms of comfortability.
Support
In the survey, 49% of people ranking street lights as the number one safety factor.
Lighting was the most common feature drawn by participants in the cultural probe.
Finding Two
Users want to run in places that are nearby open businesses with a high density of people.
Support
In the survey, heavy foot traffic ranked second overall in providing participants a sense of comfort.
Open businesses in the cultural probe drawings were also the second most common feature people cited as an important safety feature.
Finding Three
Users are skeptical of running in the dark because they are afraid for their safety.
Support
46% of participants claimed that concern for their safety prohibits them from running when it is dark outside.
Interview quote: “I don’t feel entirely safe when running outside in the dark”
Interview quote: “I associate dark areas with being more dangerous”
Finding Four
Women were more concerned about their safety while running in the dark.
Support
Only 17% of women said that they were NOT concerned with their safety, whereas 64% of men that filled they survey out said they were not concerned.
Finding Five
Users enjoy companionship as a means to feeling comfort.
Support
According to the survey, 44% of the total participants talk on the phone, 41% talk to someone in person, and 30% text during a run.
Interview Quote: “[I would feel more safe with] programs to tell people where I am so that they know I’m on a walk and if they don’t hear from me it sends them my location.”
Task Analysis

In addition to our three data collection methods, we built a task analysis of running in the dark in order to better empathize with our users and understand what opportunities we have to improve their experience.
Design Requirements
Based on our findings and task analysis we created a list of design requirements both functional and nonfunctional that our product should meet.
Functional Requirements
Users are given information about the density of safety factors on their route
Users should have a balance between customization and rooting the information in facts.
Users have control over which data is shared versus kept private
Nonfunctional Requirements
People feel a sense of companionship during their run
Users feel safe during their run in the dark
Design is familiar to existing systems to make it easier for the user to learn.
Design is accessible and usable by people of differing identities and abilities
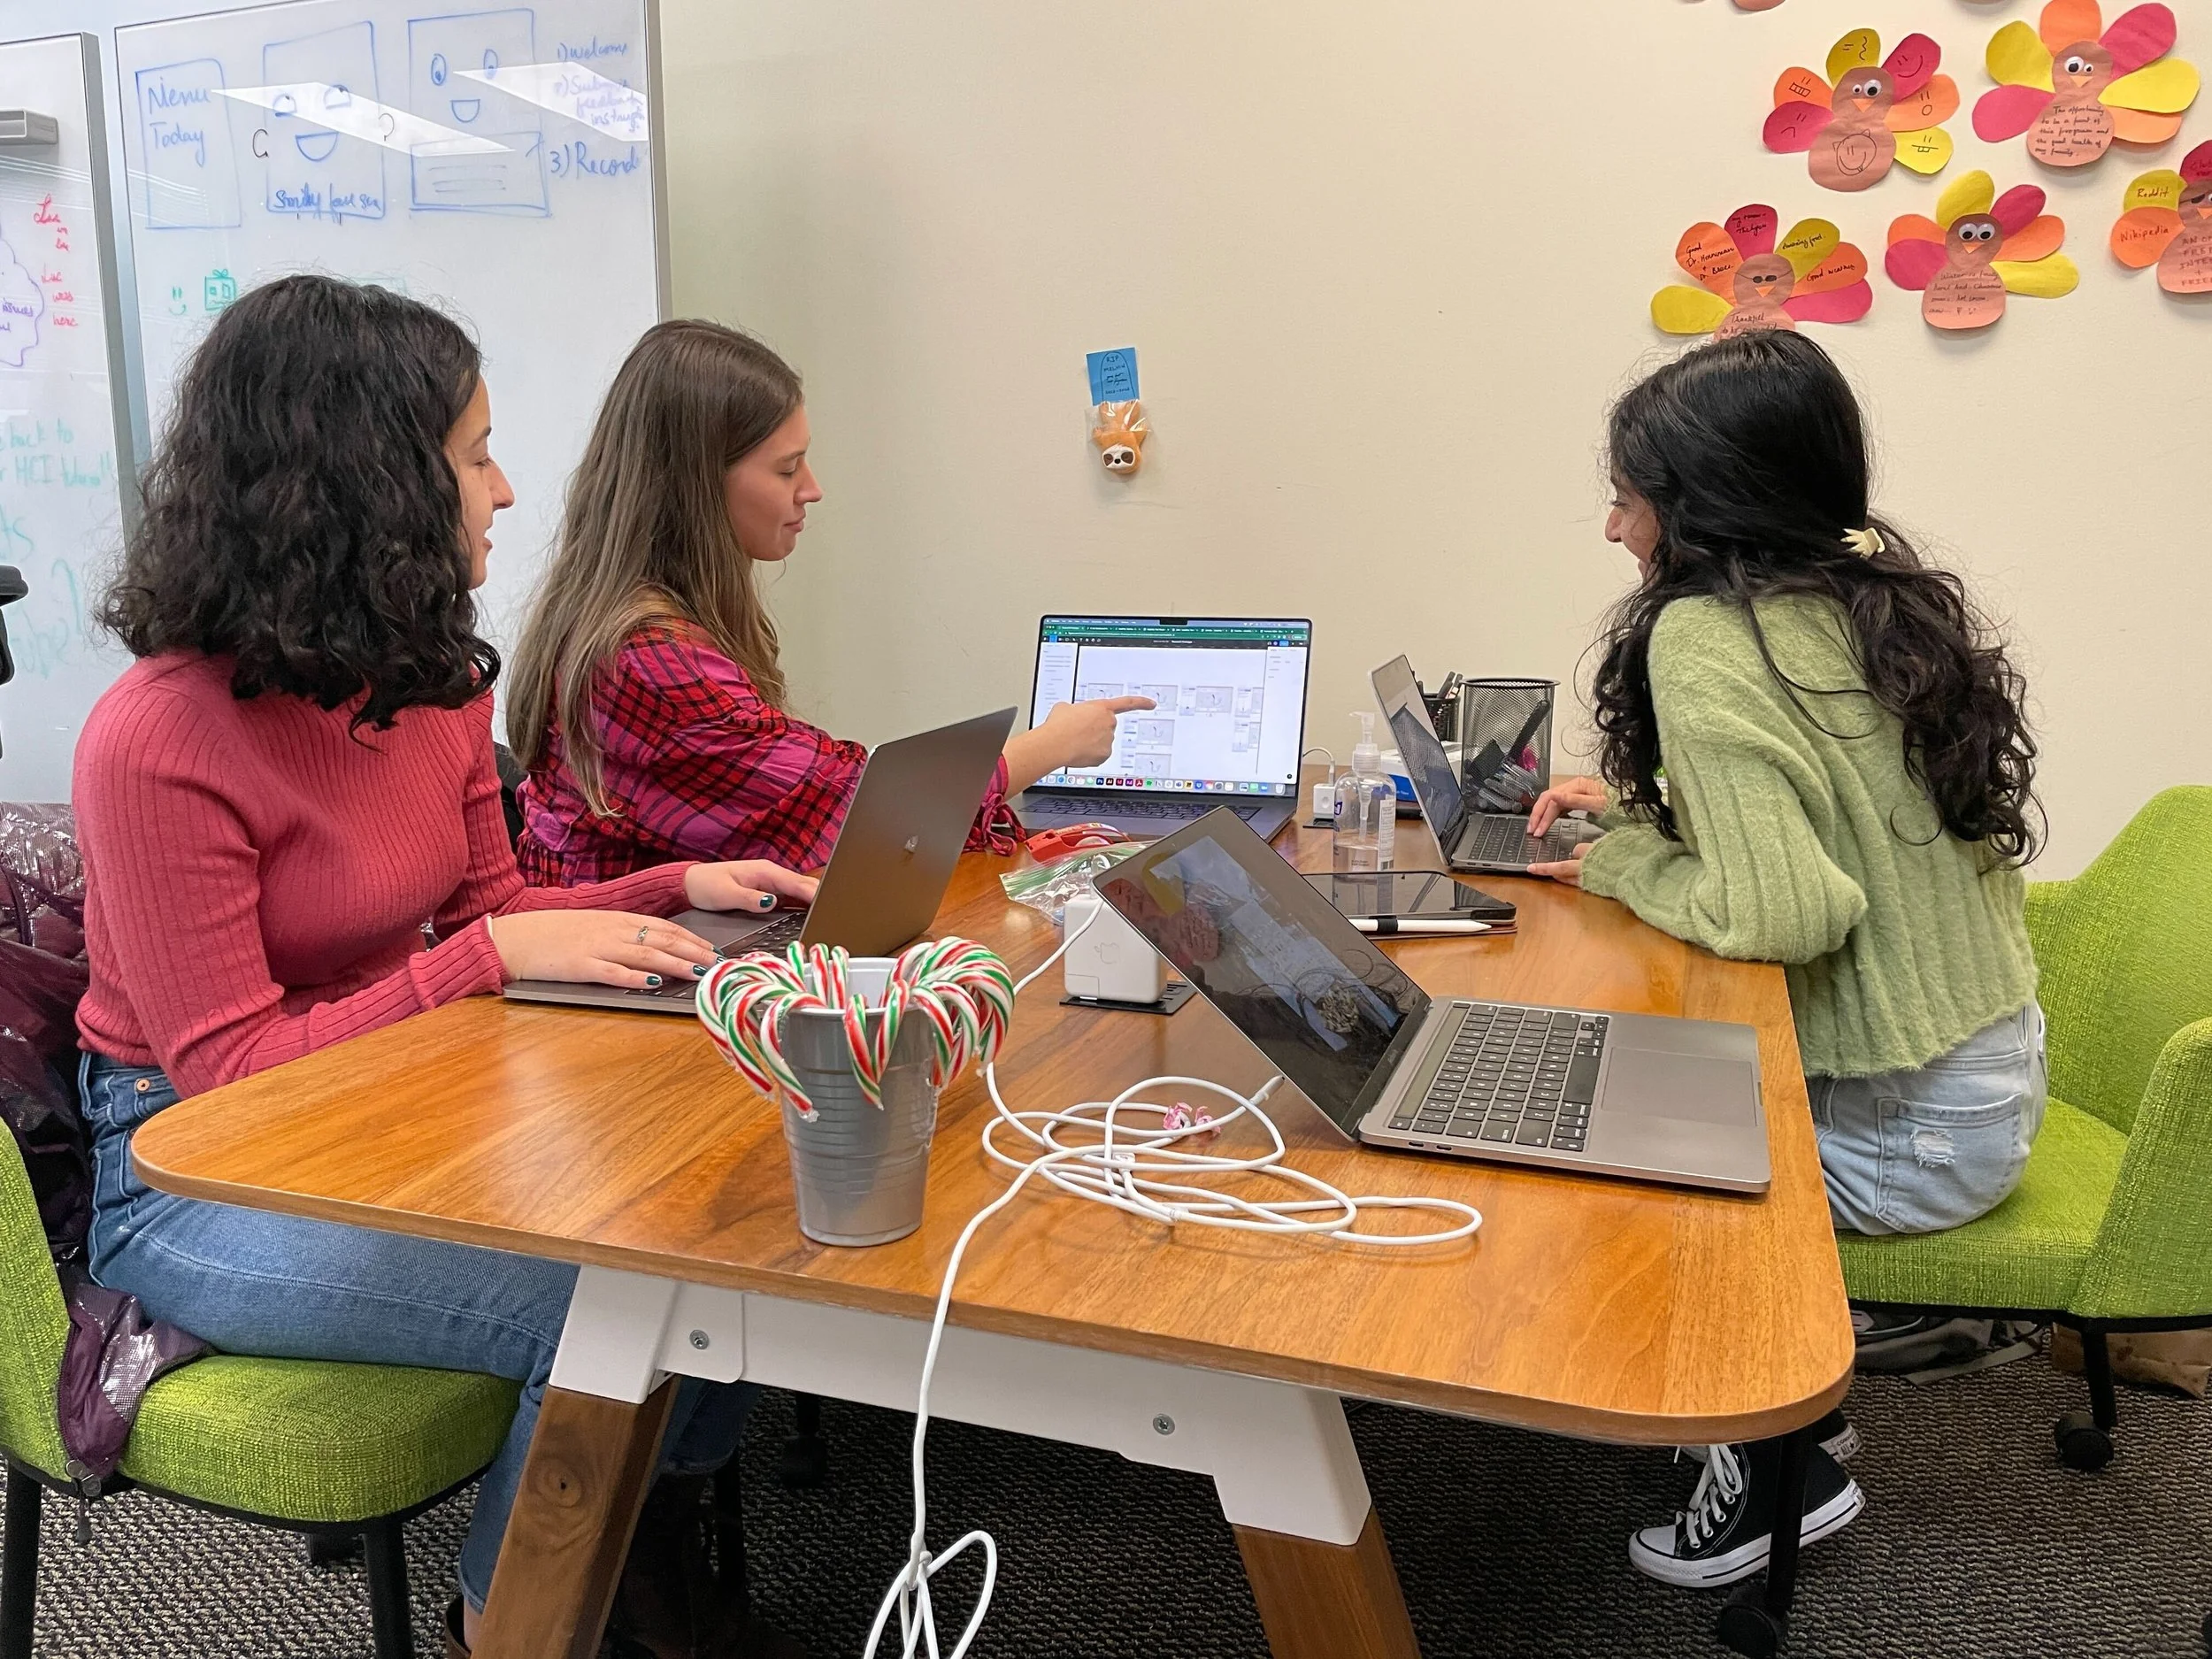
Ideation
Based on our insight driven design requirements we started an ideation process to find a solution.
1. Brainstorm Session
Based on our insights and requirements we each spent 15 minutes independently creating ideas for a solution on sticky notes.

2. Combine Ideas into 10 Core Concepts
Because of overlap in ideas, we sorted all of our proposed solutions into 10 main concepts that held the most promise and gave them a name and description.

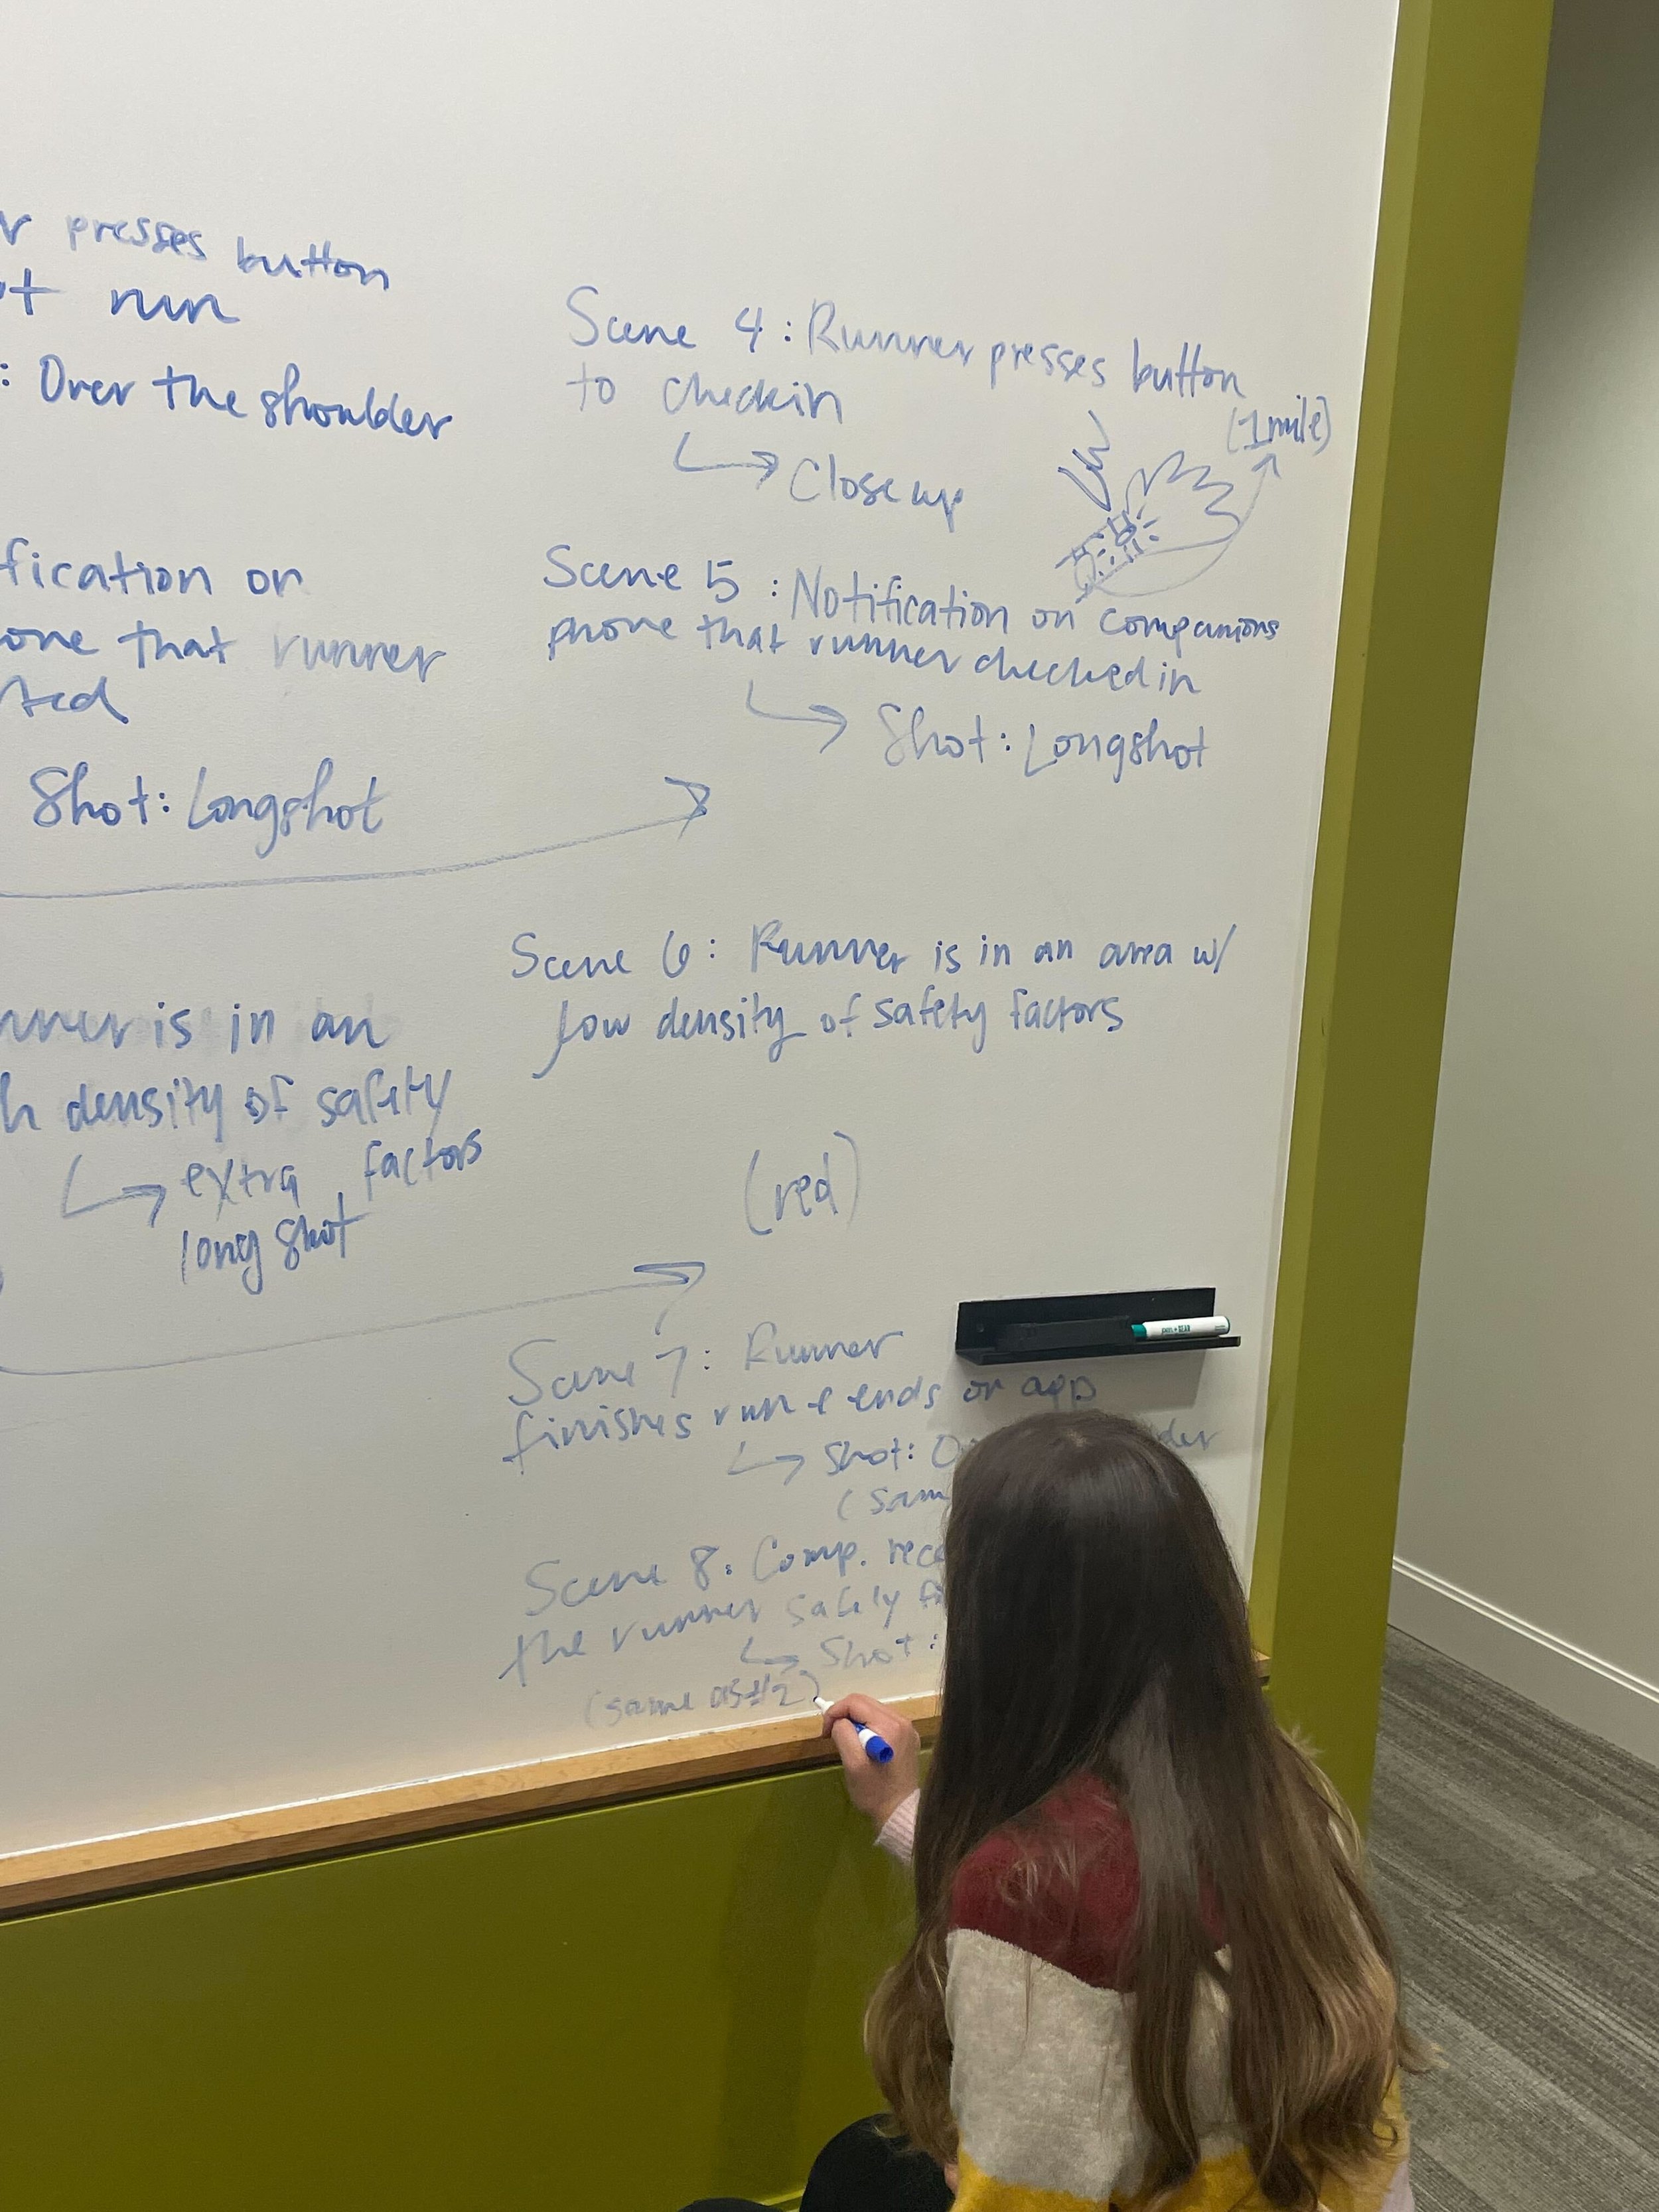
3. Visual Representations
With our 10 concepts, we added rough visuals to represent our idea.

4. Sketches
To better represent our concepts, we translated the rough visuals into 10 sketches.

Concept Evaluation & Final Solution

With both of these ideas fleshed out within a storyboard, we were able to understand how our ideas would play out in a real world scenario. We took these storyboards and showed them to runners, and based on their feedback and our design requirements decided that the Loca Bracelet with a companion application would be the best solution.
Loca Bracelet with Companion App Benefits
Bracelet would be small enough to not interfere with the user’s existing running watch
Runner can focus on their run rather than watching their phone for safety updates that may distract them from their surroundings and fitness goals
The phone will function as the user interface to review the metrics of their run and manage their runner/monitor relationships
Empowers individuals of all socioeconomic levels to start running because they can buy into a bracelet more easily than investing in a watch
Bracelet uses color and haptics to indicate density of safety factors, so it is accessible to users of all abilities
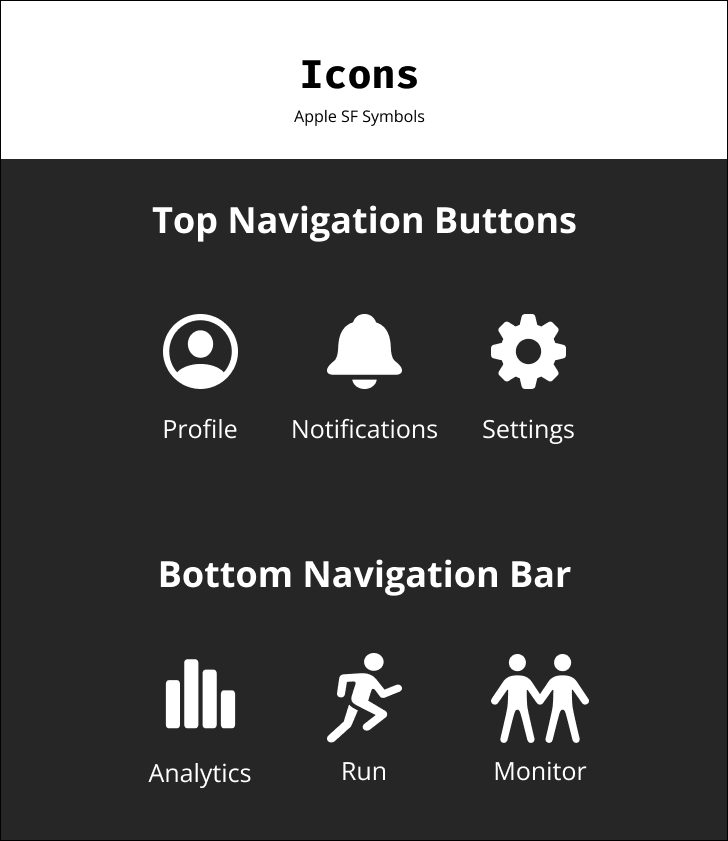
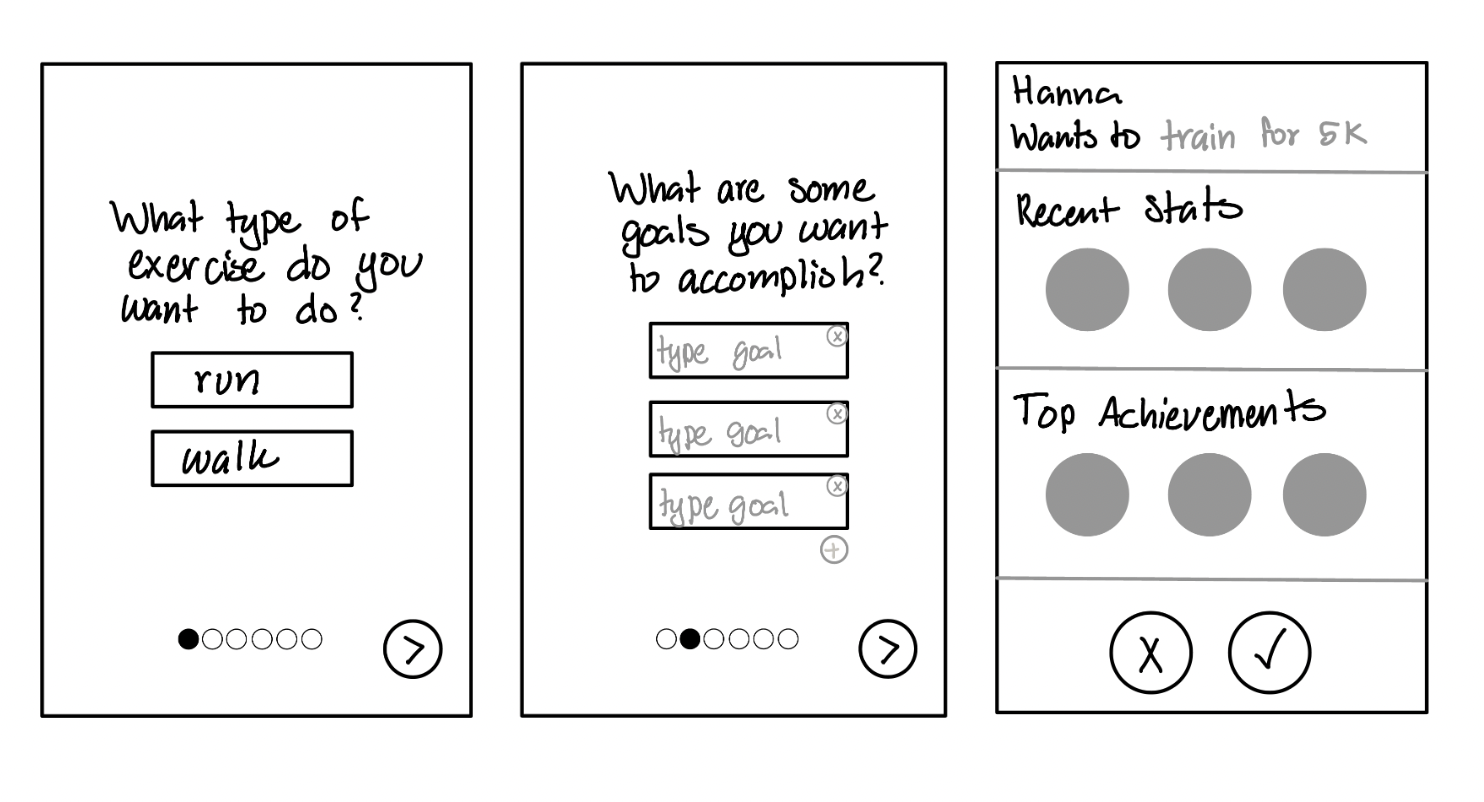
Wireframing
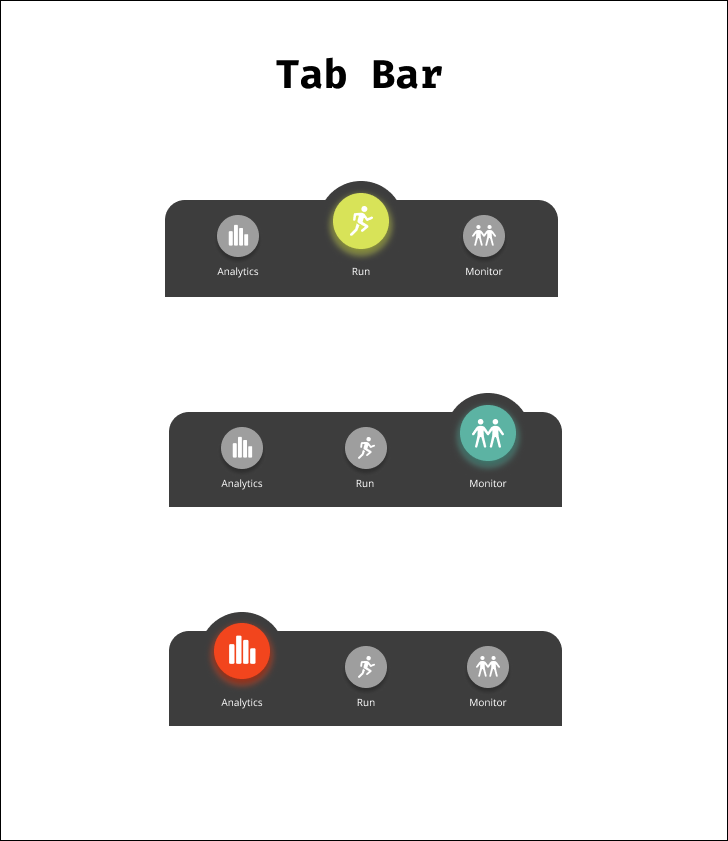
With our final idea in place, we moved on to the first phase of prototyping: wireframing. During this portion of our project, we first decided on the information architecture for the companion app and split the functions into three main tabs.

App Experience #1: Run Tab / Home
Functions:
Runner can select their companion that will remotely monitor their run
Records their mileage and distance, but does not record their location data
Similar to the bracelet, the app will glow and pulse with green in an area with a high density of safety factors, red in an area with a low density of safety factors, and white during a checkpoint
Provides end of run stats that include a safety factor rating score and data visualization that indicates the safety of their run
Running is the home page because it is the primary purpose of the app and bracelet

App Experience #2: Companion Monitor Tab
Functions:
Requests to be a run monitor will populate within the notifications here
Monitor can track the runners progress and know when they are in an area with a high density or low density of safety factors
Checkpoint completion notifications appear here, and incomplete checkpoints prompt the monitor to either call the runner or request emergency service intervention
At the completion of the run, the companion can send a celebratory sticker to form a sense of companionship
App Experience #3: Activity Tab

Functions:
The runner can view their previous run history to know which runs had the highest safety factor rating and a report on which safety factors were present during their run

App Experience #4: Settings & Profile
Functions:
Manage the user’s own profile information
Review friends/potential monitors and add more
Set checkpoint settings for the bracelet
Mileage or time for checkpoints
Haptics, color, or both for checkpoints